Introduction
Infographics (Information graphics) are graphic visual representations of information, data or knowledge. These graphics able to let us absorb the information in an effective way. In real life, we can easily find some in our surrounding, for example, maps, train route, signs and so on.
On the internet, we can find heaps of well-designed and educational infographics, on Queness, we also featured a few and including a post about how to make one:
- How to design your own infographics
- 10 Infographic geared toward designers
- 21 Extremely Beautiful Infographic inpisrations
However, in this post, we are not going to feature the common static and image based infographics. All infographics in this post are made with HTML, CSS3 and Javascript. We called it - Interactive Infographics. You can see animations, beautiful illustrations and interactivity that able to present all the data into meaningful informations.
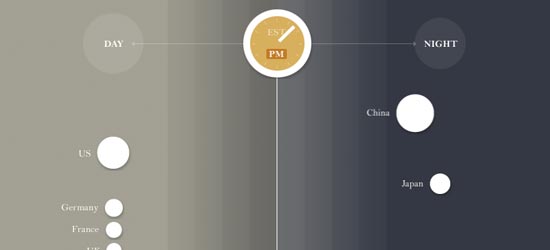
- Is the Internet Awake? An Approximate view of day and night in the top 25 countries by number of broadband internet users.
![]()
- Intacto 10 Years of History A work that shows our decade of history through a digital universe trip.
![]()
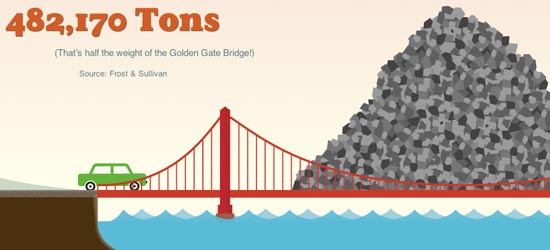
- Future of Car Sharing The Bright Future of Car Sharing Infographic.
![]()
- Sandalous Dirt Discover all the hot conversations and topics over twitter community.
![]()
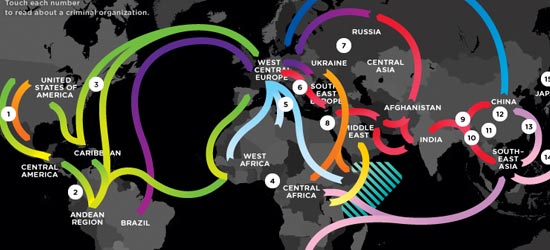
- Organized Crime: THe World's Largest Social Network The Mafia, la Cosa Nostra, the Yakuza, Mexican cartels - the underworld is ruled by a complex network of criminal groups. Here's how they fit together/
![]()
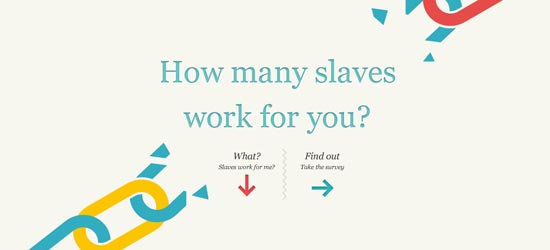
- How many slaves work for you? Interactive Infographic. It calculates number of slaves based on your input on different questions.
![]()
- You VS. John Paulson Compare your earning with the super trader John Paulson. *Thanks Michael Berg for this infographic.
![]()


Comments will be moderated and
rel="nofollow"will be added to all links. You can wrap your coding with[code][/code]to make use of built-in syntax highlighter.https://mahifx.com/john-paulson/
I am doing a project concering interactive infographics and I've never done anything like it. So I am wondering if anybody knows any ressources on how to create graphics like those above?
Help would really be appreciated!
http://www.drypin.com/?p=663