Introduction
News designers and web developers know that a good informational graphic is more than just flashy images or statistics slapped on a three dimensional bar graph. The best infographics should attract an audience’s attention with simple, relevant images, and hold their attention with a compelling story told in visual shorthand. Strong infographics have concise, accurate headlines that let readers know the significance of the story at a glance. At the core of a truly captivating infographic is the grain of truth it conveys. For this reason, designers in particular should enjoy and learn something about their craft from these 10 clever design-focused infographics.
- "How would you like your graphic design?" – Colin Harman
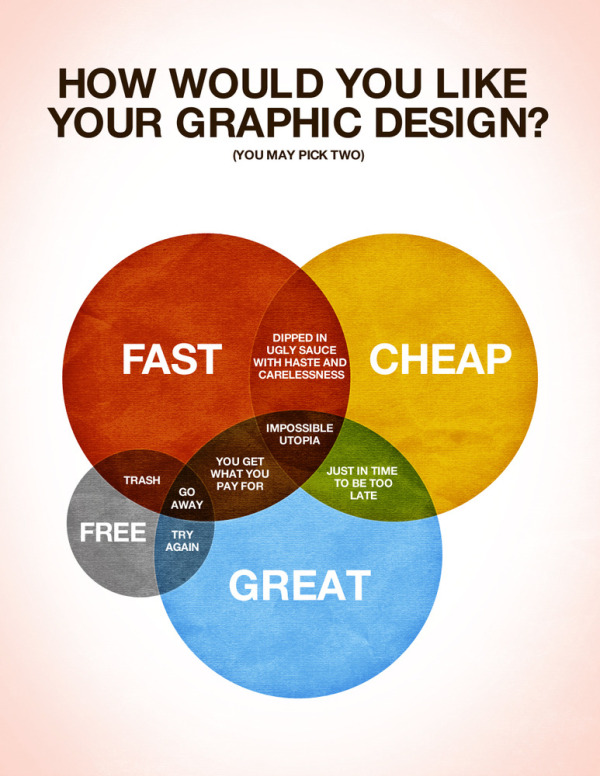
![How would you like your graphic design?]() In this ingenious take on the old school Venn diagram, designer Colin Harman presents a light-hearted but realistic guide to what limited resources can produce.
In this ingenious take on the old school Venn diagram, designer Colin Harman presents a light-hearted but realistic guide to what limited resources can produce. - "Which designer job is best?" – Shane Snow
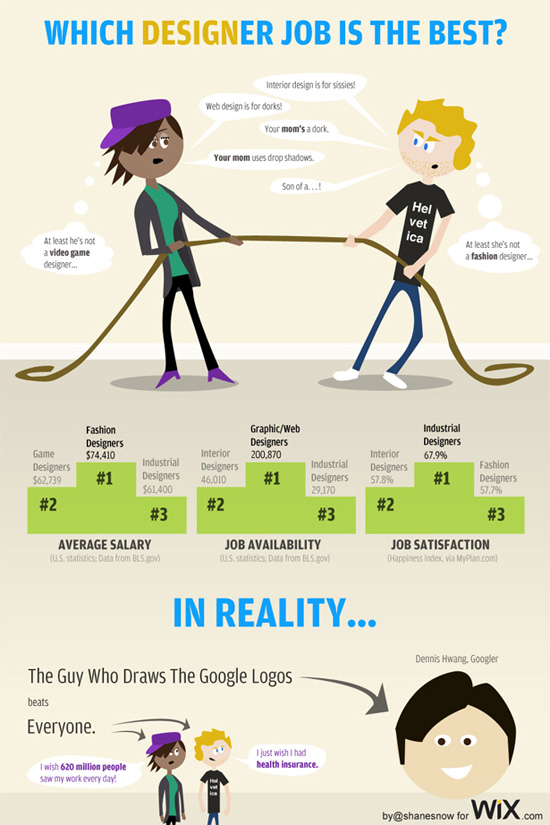
![Which designer job is best?]() Topped with a tug-of-war illustration between two designers at opposite ends of the hip-geek spectrum, Shane Snow’s infographic is instructive for students of design who have yet to pick their career.
Topped with a tug-of-war illustration between two designers at opposite ends of the hip-geek spectrum, Shane Snow’s infographic is instructive for students of design who have yet to pick their career. - "Colours in Culture" – David McCandless
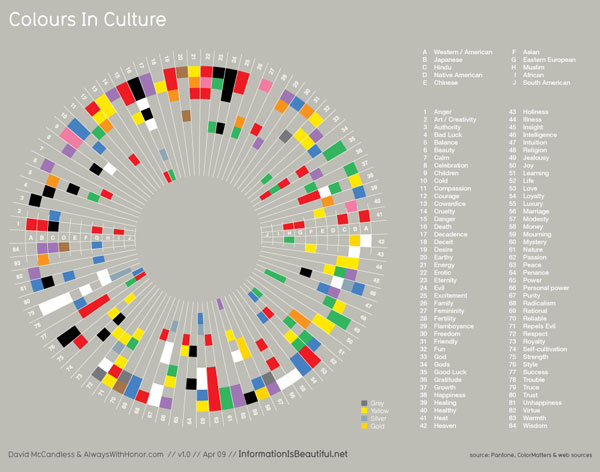
![Colours in Culture]() A striking color wheel presents a huge amount of information on the cultural symbolism of color. McCandless’s graphic makes an ideal tool for designers working for international clients.
A striking color wheel presents a huge amount of information on the cultural symbolism of color. McCandless’s graphic makes an ideal tool for designers working for international clients. - "Periodic Table of Typefaces" – squidspot.com
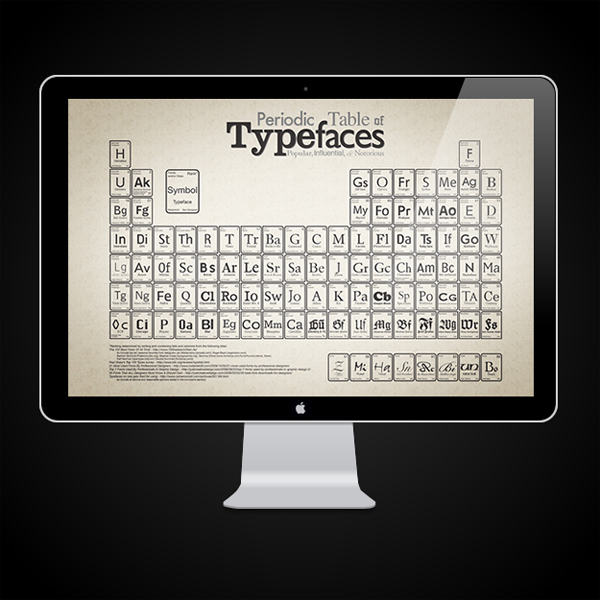
![Periodic Table of Typefaces]() Fashioned after the classic periodic table of the elements, this infographic provides a wealth of typographical information for designers at a glance. Each square on the table contains an abbreviation of the featured font, the font’s designer and a ranking.
Fashioned after the classic periodic table of the elements, this infographic provides a wealth of typographical information for designers at a glance. Each square on the table contains an abbreviation of the featured font, the font’s designer and a ranking. - "Web Trend Map 5" – Information Architects
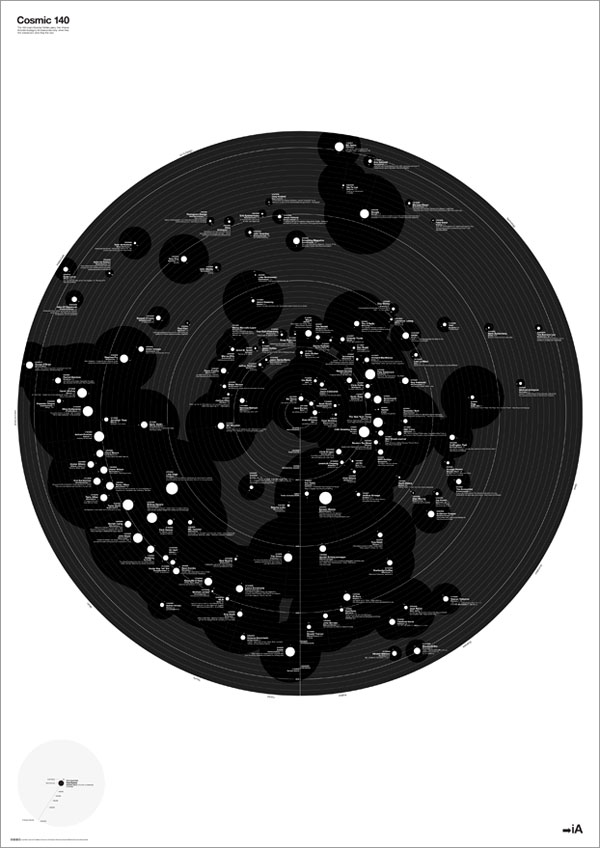
![Web Trend Map 5]() The Web Trend Map is released every so often and this year it features 140 of the most influential people on Twitter. These fantasic ladies and gents are sorted by #name #handle #category #influence #activity as well as when they started tweeting and what they said first.
The Web Trend Map is released every so often and this year it features 140 of the most influential people on Twitter. These fantasic ladies and gents are sorted by #name #handle #category #influence #activity as well as when they started tweeting and what they said first. - "Do You Need a New Logo?" – Watermark Designs
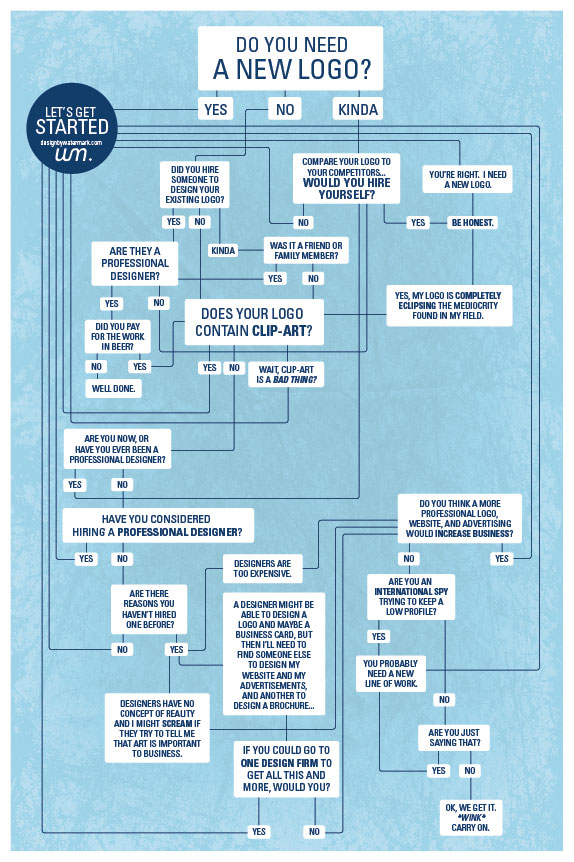
![Do You Need a New Logo?]() Mirroring the classic flowchart, this graph shows the mental process that a designer, or company for that matter, should go through before deciding on redesiging their logo.
Mirroring the classic flowchart, this graph shows the mental process that a designer, or company for that matter, should go through before deciding on redesiging their logo. - "Google Graphic" – ppcblog.com
![Google Graphic]() An essential for web designers, this detailed flowchart maps the process Google uses to vet its search results and place pages at what it feels is the appropriate ranking.
An essential for web designers, this detailed flowchart maps the process Google uses to vet its search results and place pages at what it feels is the appropriate ranking. - "True Colors" – KISSMetric
![True Colors]() Colors are generally born without rules however this infograph says differently. True Colors maps the color prefrences by gender which comes in handy when deciding on the best color to appeal to your audience.
Colors are generally born without rules however this infograph says differently. True Colors maps the color prefrences by gender which comes in handy when deciding on the best color to appeal to your audience. - "The Evolution of the Web" - Google Chrome team (with Hyperakt and Vizzuality)
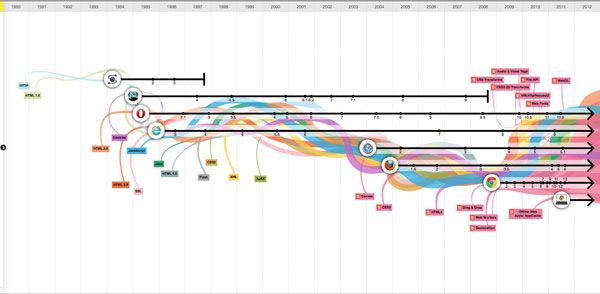
![The Evolution of the Web]() The Evolution of the Web is an interactive timeline of the evolution of web browsers over the past 20 years. Clicking on the browser icon will give you a preview of each version the browser has ever released.
The Evolution of the Web is an interactive timeline of the evolution of web browsers over the past 20 years. Clicking on the browser icon will give you a preview of each version the browser has ever released. - "U.S. Data Consumption in One Day" – fastcompany.com
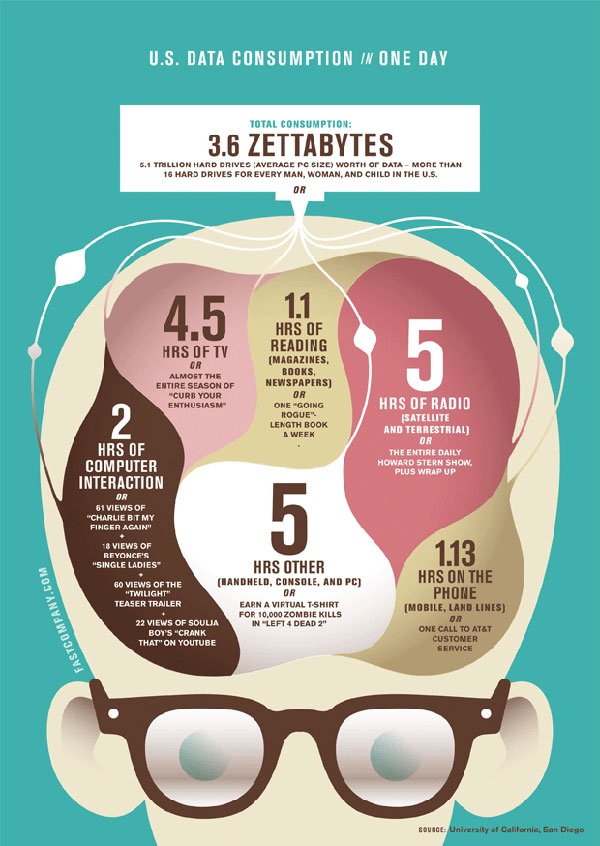
![U.S. Data Consumption in One Day]() Designers already know they spend a lot of time dealing with media, but this retro-looking infographic by fastcompany.com breaks it down by the numbers. The image features stylized lobes of the human brain filled with various forms of media and gives an American’s average daily intake of data.
Designers already know they spend a lot of time dealing with media, but this retro-looking infographic by fastcompany.com breaks it down by the numbers. The image features stylized lobes of the human brain filled with various forms of media and gives an American’s average daily intake of data.


These 10 infographics span the gamut from tongue in cheek commentaries on a designer's work environment to the nuts and bolts of the world's most popular search engine. But they share in common clear, communicative presentations and effective use of color and images. As a result, these graphics can serve as both resources and inspiration for graphic artists or web designers who want to hone their craft.
Comments will be moderated and
rel="nofollow"will be added to all links. You can wrap your coding with[code][/code]to make use of built-in syntax highlighter.