WordPress is still the most popular blogging platform. It is the simplest website builder out there.Â
Its goal is to offer a blogging platform for anyone without previous experience in web development. That is the reason why today WordPress is being used by millions of bloggers around the world.Â
Everybody can set up a website effortlessly. Going from its installation, theme set up until creating content is a straightforward task.
If we now jump to the debugging side you will find the same principle. Keep it simple. WordPress make debugging a task quite easy.
Debugging is a common technique used in the development process. The aim is to debug code snippets to identify any issue and resolve them.
Sometimes it seems you will not see or have any single issue that requires you debugging. That world doesn't exist. In fact, in the real world more than one time you will come across WordPress site issues that will demand you take a look and see what's going on under the hood.
If you find yourself in such a situation, here you find a few tips when it comes to debugging a WordPress site.
Use WordPress Built-in Debug Mode
WordPress comes equipped with the debugging feature so is quite easy to do it. You can find errors, deprecated functions, or any missing system requirement during code execution on your site.Â
WordPress offers you its built-in debug mode to help you on your debugging journey.Â
If you need extra or custom debugging features you can also add useful third-party tools for debugging.
Understand the Types of PHP Errors
Notice: The least important error message. This type of error means that the program contains something wrong but it allows the execution of the script. Indicates there's a possible improvement.
Warning: A more critical error compared with the Notice. The main reason for warning errors are including a missing file. This means that the PHP function calls the missing file.
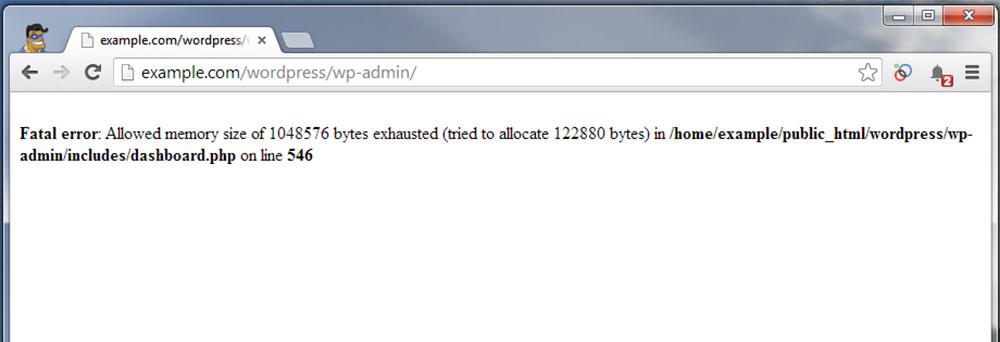
Fatal error: A critical error message. It is the type of error where the PHP compiler understands the PHP code but it recognizes an undeclared function.
Set Up Different Testing EnvironmentsÂ

A common mistake among developers is to test live websites. Having proper test environments will save money, time, and user experience.
It seems simple but it is incredible how many developers still fall into this bad practice.
Testing should be done in local or staging environments since it is likely more than one user is visiting the website while you make the tests. This will break something and by consequence generating a bad user experience.
The only thing to keep in mind is that your testing environment should be synced with the production one.
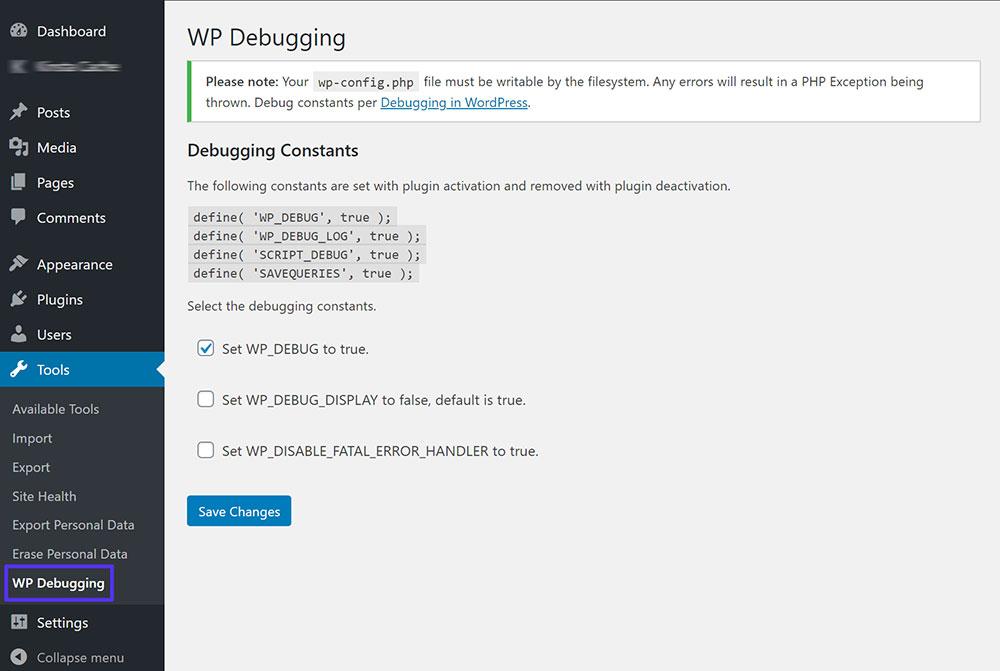
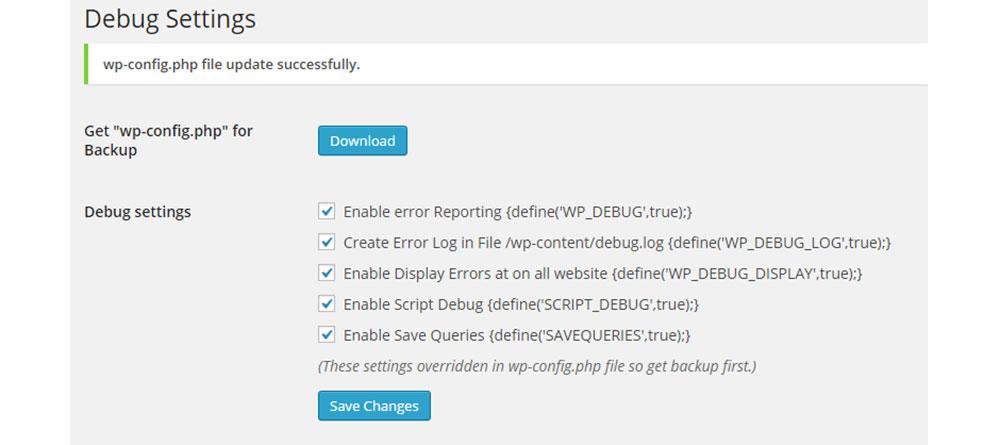
Turning on the WP_DEBUG Constant
If you want to track what is happing under the hood on your WordPress site you need to turn on the WP_DEBUG constant on your site's files.
This is especially useful when an issue comes up. By turning on this constant WordPress will trigger the debug mode.
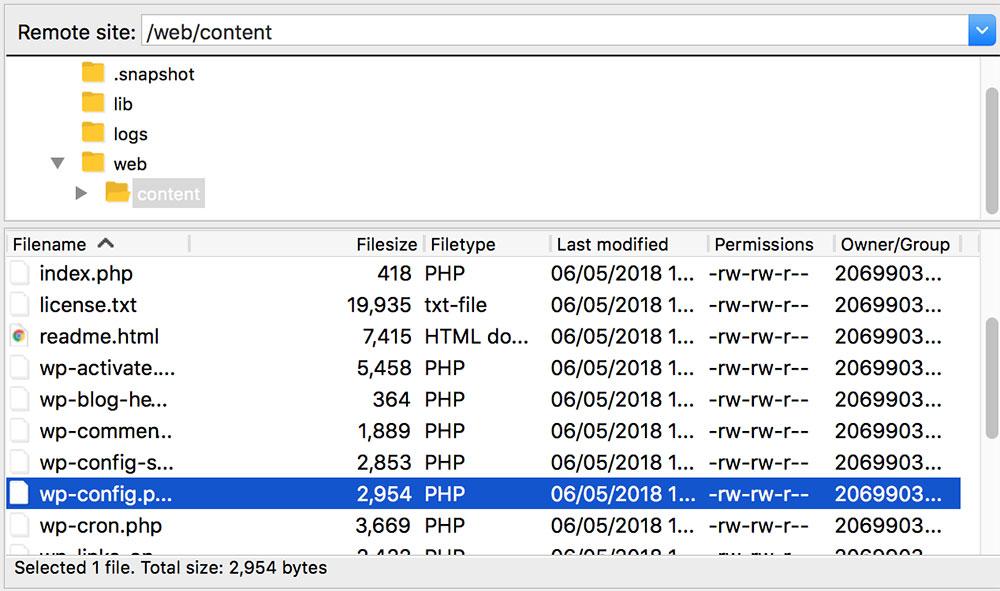
By default this constant is set to false, you can change it on the wp-config.php file on the development environments. It is not a good idea to turn on production environments.
Keep in mind that WP_DEBUG and other debug tools are thought to be used on local and staging installations.
Track Errors Enabling Debug log
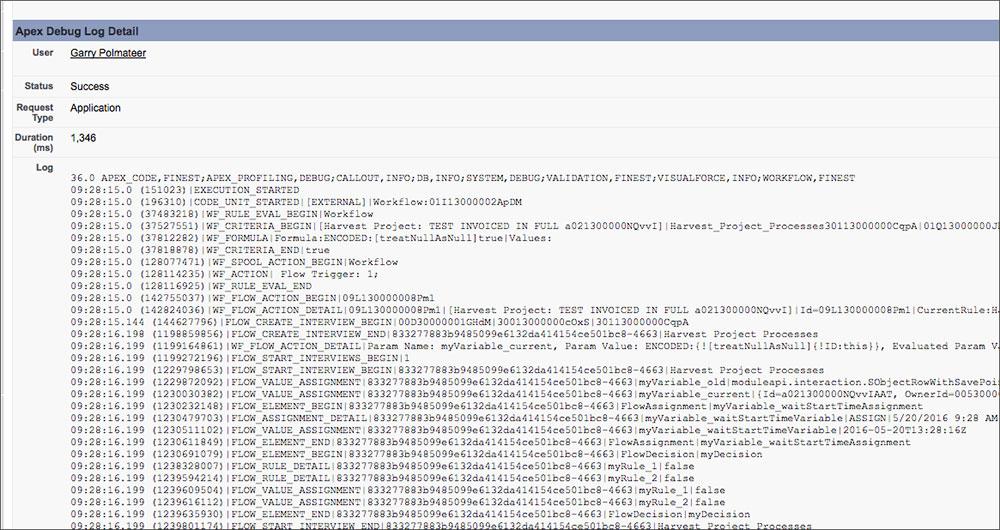
Part of the debugging task includes seeing and tracking apps or server logs. By default, WordPress debug mode will only show you the error messages at the moment. This means they will disappear after at some point since you are saving them anywhere.
If you want to see what happened two days ago, one day ago or a few minutes back you have to enable the WordPress debug log. By doing this you ensure errors are being sent to a file on the server.
Use of WP_DEBUG_DISPLAYÂ

This another useful WordPress constants while debugging. It controls whether debug error messages are shown inside the HTML of pages.
By default, it is set to TRUE what means will show error messages when they are generated. If you don't want to show the errors just need to set it to FALSE.
It's another way to show or not your site errors. You can use it together with the WP_DEBUG_LOG so you can save the errors and check them later since they will send to the file on the server
JS and CSS Debug

If you want to debug CSS and JavaScript files they shouldn't be minified. SCRIPT_DEBUG constant is a built-in feature that will help you with that task. By enabling it you can test change to built-in .js or .css files.
Server Error Logs
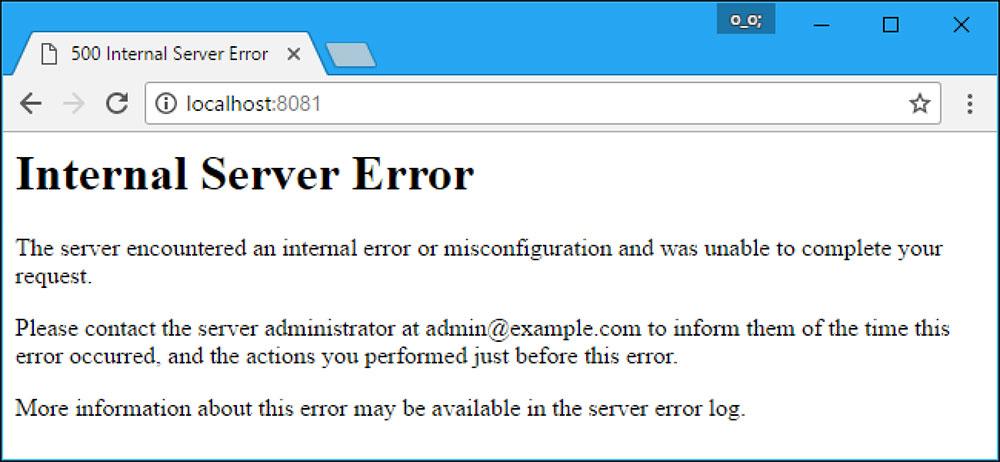
There are some PHP and WordPress errors you will want to catch and save them somewhere. If your script exceeded the maximum allowed run time you will get a PHP error.
The web server will trigger an error message saying what happened.
Under this scenario, you need to check the server logs to see what is the issue or at least have a better idea about the error. The error log file will say you if it is related to your PHP or WordPress installation.
You can find it on your web hosting provider or wherever is your server is located.
Use WPDB to Database Debug
Your WordPress database is an important resource to debug. So, WordPress defines a class called wpdb, which contains a set of functions used to interact with a database. Its primary purpose is to provide an interface with the WordPress database.
This class ensures that any query to the database execute properly and if there's an error this interface will show it. So, enable it to debug things on your database.
Disable Browser Cache
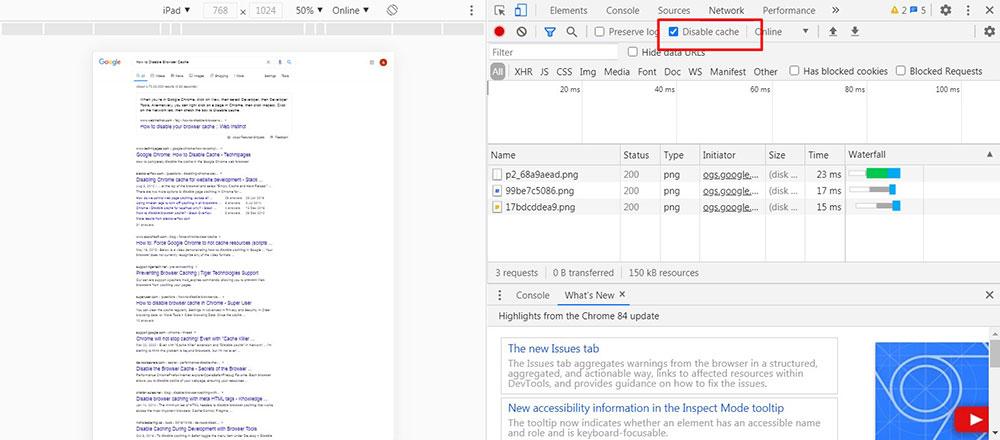
This feature is more oriented for front-end developers since they need to test the JS files and with the browser cache enable is impossible.
So if you are working on the frontend disable the browser cache to see the new errors. If you don't do this the browser cache will not allow you to see them you will be seeing the old JS and CSS files.
By disabling browser cache you command to the browser to not store old files, mainly JS and CSS.
Track and stay on top of things

https://wordpress.org/plugins/wpstream/
Know what happened every time on your website is a good idea. You can have a detailed record of every change using an awesome plugin called WP Stream.
This plugin is designed for debugging and compliance purposes. Stream is useful for keeping tabs on your WordPress users: From activating plugins to deleting posts. You can track login attempts and new user creation. you can see what’s changed, who changed it and when.
Debugging Plugins
Plugins are an essential part of a WordPress site. So it is a great idea to debug them in one way or another. Debugging plugins will help you to understand what's going on under the hood.Â
The following are a few plugins for debugging.

This plugin allows several tabs information such as PHP, Memory usage, Load Time, Included Files, Server, and much more.
If you have the right permissions on your WordPress installation you can see all this information.
With all the information this plugin offers you can analyze errors but also to better understand how WordPress works.
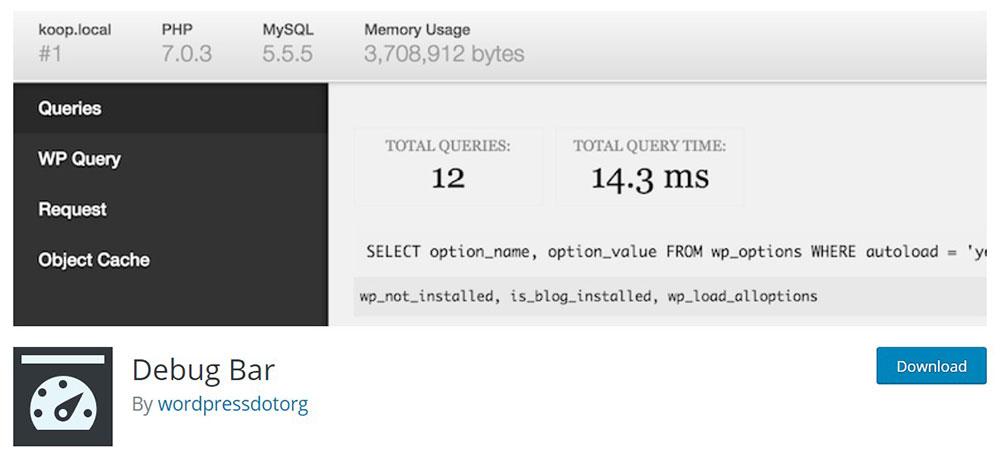
This plugin adds a debug menu to the admin bar that shows query, cache, and other helpful debugging information.
After you have installed it you will recognize it because you see a new Debug button. You can start debugging just by clicking on it
While is it true this plugin is essential for developers it is also true end users can use it.
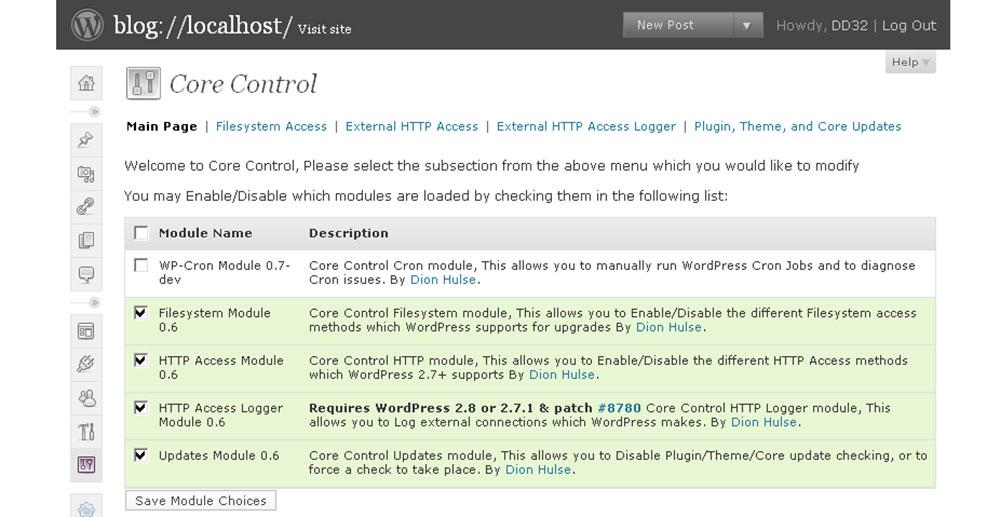
Core Control is a set of plugin modules which can be used to control certain aspects of the WordPress control.
Part of its features includes Filesystem Access, Managing plugin/theme/core updates, Managing HTTP.
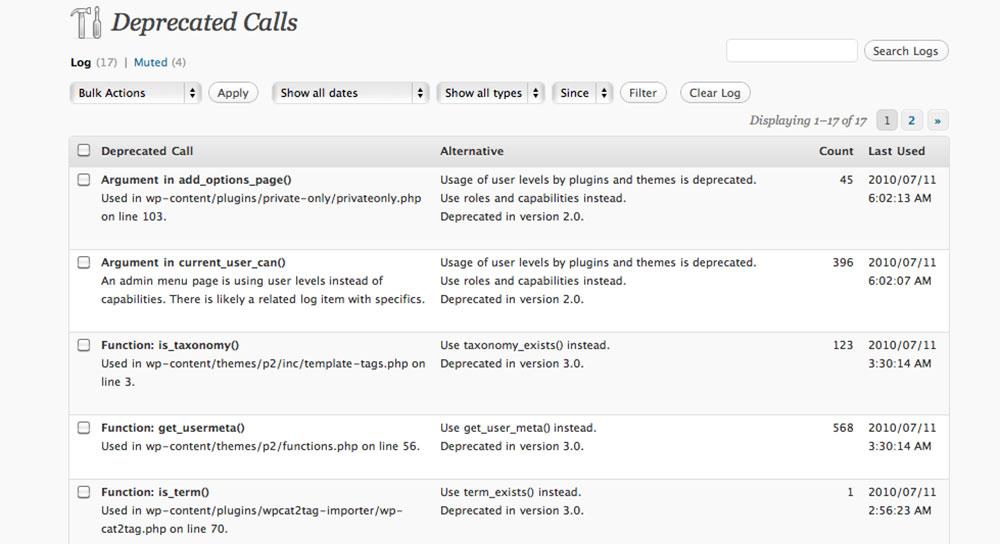
This is a plugin for developers. WP_DEBUG is not needed, though its general usage is strongly recommended. Deprecated notices normally exposed by WP_DEBUG will be logged instead.
It is helpful when it comes to knowing if a function, file, or any functionality is outdated since it offers suitable alternatives.

Showing error is good but it is much better to analyze your website for possible errors before they happen. Firebug will help you with this task.
Firebug is a sophisticated debugging plugin that looks for any network problems and design flaws.
It is mainly an add-on of the Mozilla Firefox browser, but a lite version is also available for other browsers.
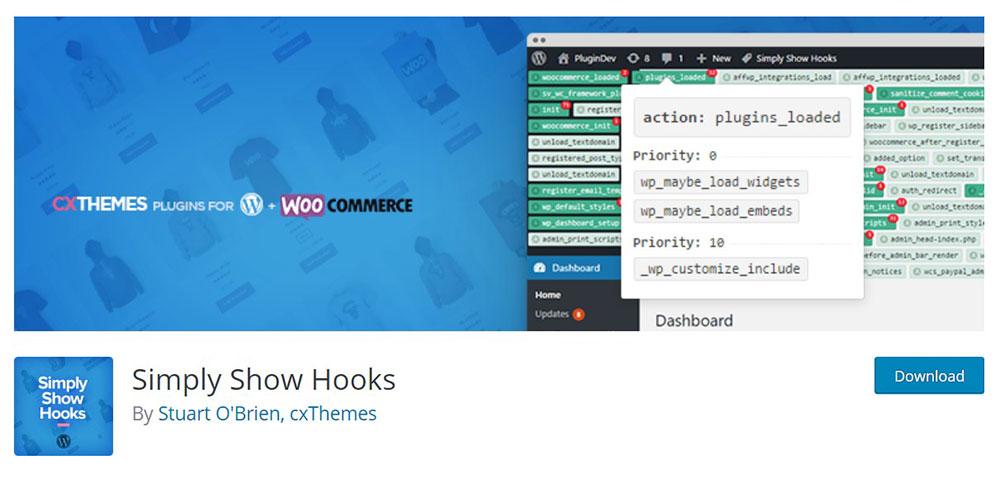
The good thing about this plugin is that will tell you what action or filter hooks that run on any page. You can then start analyzing and debugging. You can also see the attached methods for every hook. And even find out the priority of each.
In other words, with this plugin, you can find WordPress hooks quicker and use it all the time.
All these tips will help you to have more stable WordPress sites so they make users happier while they navigate on it.
The simplest task of debugging is to be able to check the log file hosted on your web server.
Keep in mind that the idea behind debugging is to know what's going on under the hood. Also, act and resolve faster. The more eyes you have on a site, the more chances you’ll get to find issues.
You might find a lot of errors in WordPress, like the “you are not allowed to access this page†error or “the site is experiencing technical difficultiesâ€. First debug, then look for other ways to solve them. It’s the best way.
Comments will be moderated and
rel="nofollow"will be added to all links. You can wrap your coding with[code][/code]to make use of built-in syntax highlighter.